
Analytics and reporting
Reporting that shows which pages, campaigns, and systems create opportunities.
Vizion Space builds practical measurement layers using GA4, Search Console, conversion tracking, and dashboards so decisions are based on real signals.
Problems We Solve
The work starts where growth is leaking.
Paired solution
Review GA4, Search Console, conversion events, forms, and reporting gaps before adding more dashboards. For Analytics & Reporting, this supports the page promise directly: Vizion Space builds practical measurement layers using GA4, Search Console, conversion tracking, and dashboards so decisions are based on real signals. It addresses decision tracking with GA4 review, Search Console review, and Conversion event map: Tracking exists, but it does not answer what should be improved next. The fix separates real blockers from cosmetic issues, then gives the team a prioritized path for crawl access, metadata, schema, page quality, and conversion tracking.
Paired solution
Measurement cleanup
Review GA4, Search Console, conversion events, forms, and reporting gaps before adding more dashboards. For Analytics & Reporting, this supports the page promise directly: Vizion Space builds practical measurement layers using GA4, Search Console, conversion tracking, and dashboards so decisions are based on real signals. It addresses decision tracking with GA4 review, Search Console review, and Conversion event map: Tracking exists, but it does not answer what should be improved next. The fix separates real blockers from cosmetic issues, then gives the team a prioritized path for crawl access, metadata, schema, page quality, and conversion tracking.
Deliverables
Clear outputs your team can use after launch.
Every Analytics & Reporting engagement leaves behind practical assets tied to implementation, ownership, and review. The goal is a cleaner operating path, not a static recommendation deck.
Audit the current path
Review the site, offer, lead flow, tracking, and operating constraints before recommending changes.
Build the first useful layer
Ship the pages, systems, tracking, or workflows that remove the clearest growth bottleneck.
Measure and improve
Use reporting, client feedback, and qualified lead quality to decide what gets scaled next.
GA4 review
Creates a review rhythm for pages, sources, actions, and lead quality so reporting turns into decisions.
Search Console review
Creates a review rhythm for pages, sources, actions, and lead quality so reporting turns into decisions.
Conversion event map
Clarifies which actions should count, which signals are diagnostic, and how conversion data should guide optimization.
Dashboard structure
Creates a review rhythm for pages, sources, actions, and lead quality so reporting turns into decisions.
Monthly reporting notes
Creates a review rhythm for pages, sources, actions, and lead quality so reporting turns into decisions.
Optimization backlog
Defines the asset, owner, review point, and next action needed to make the work useful after delivery.
Service Depth
Subservices under Analytics & Reporting
GA4 reporting
GA4 Reporting
Review and structure GA4 events, traffic, forms, and page performance so reporting supports SEO, ads, and conversion decisions.
Explore pageSearch Console reporting
Search Console Reporting
Use Search Console to review queries, pages, indexing, CTR, and service-page opportunities without overreacting to noisy data.
Explore pageMarketing dashboards
Marketing Dashboards
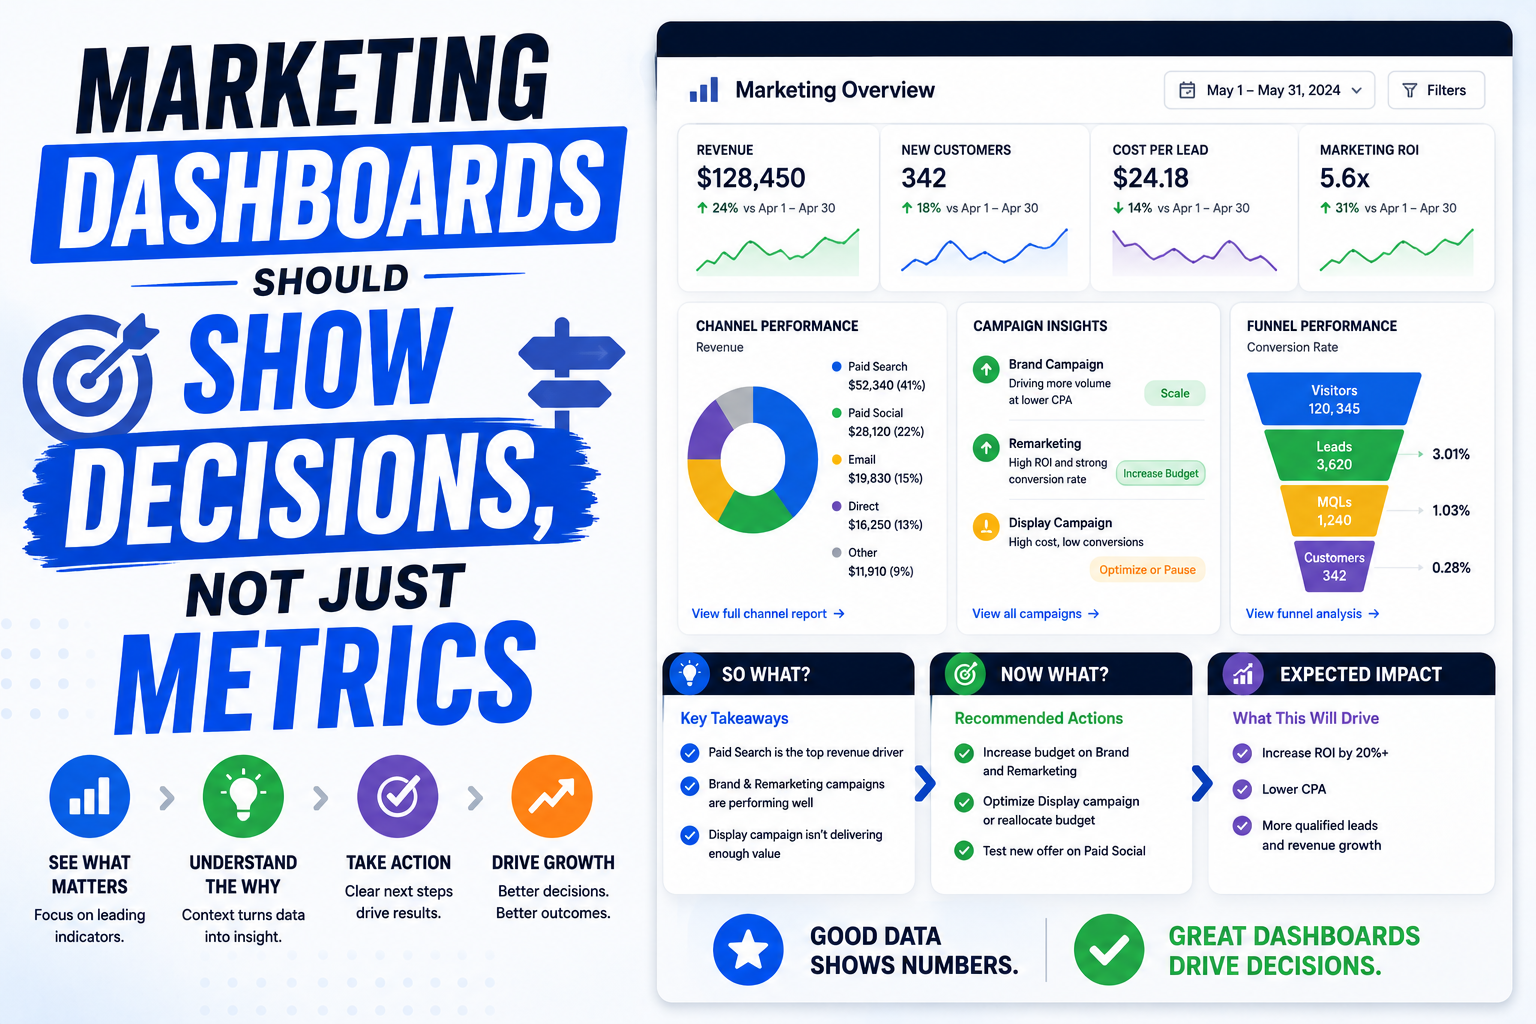
Build reporting views that show what is happening across channels and what decisions should happen next.
Explore pageDelivery Process
Simple enough to start. Structured enough to scale.
Analytics & Reporting work moves through a tight operating rhythm: diagnose the real constraint, ship the highest-leverage layer, then use real signals to decide what deserves expansion.
Phase 1
Audit the current path
Review the site, offer, lead flow, tracking, and operating constraints before recommending changes.
Phase 2
Build the first useful layer
Ship the pages, systems, tracking, or workflows that remove the clearest growth bottleneck.
Phase 3
Measure and improve
Use reporting, client feedback, and qualified lead quality to decide what gets scaled next.
Filtered Case Studies
Relevant case study proof for this service.
Local SEO and Google Maps exposure
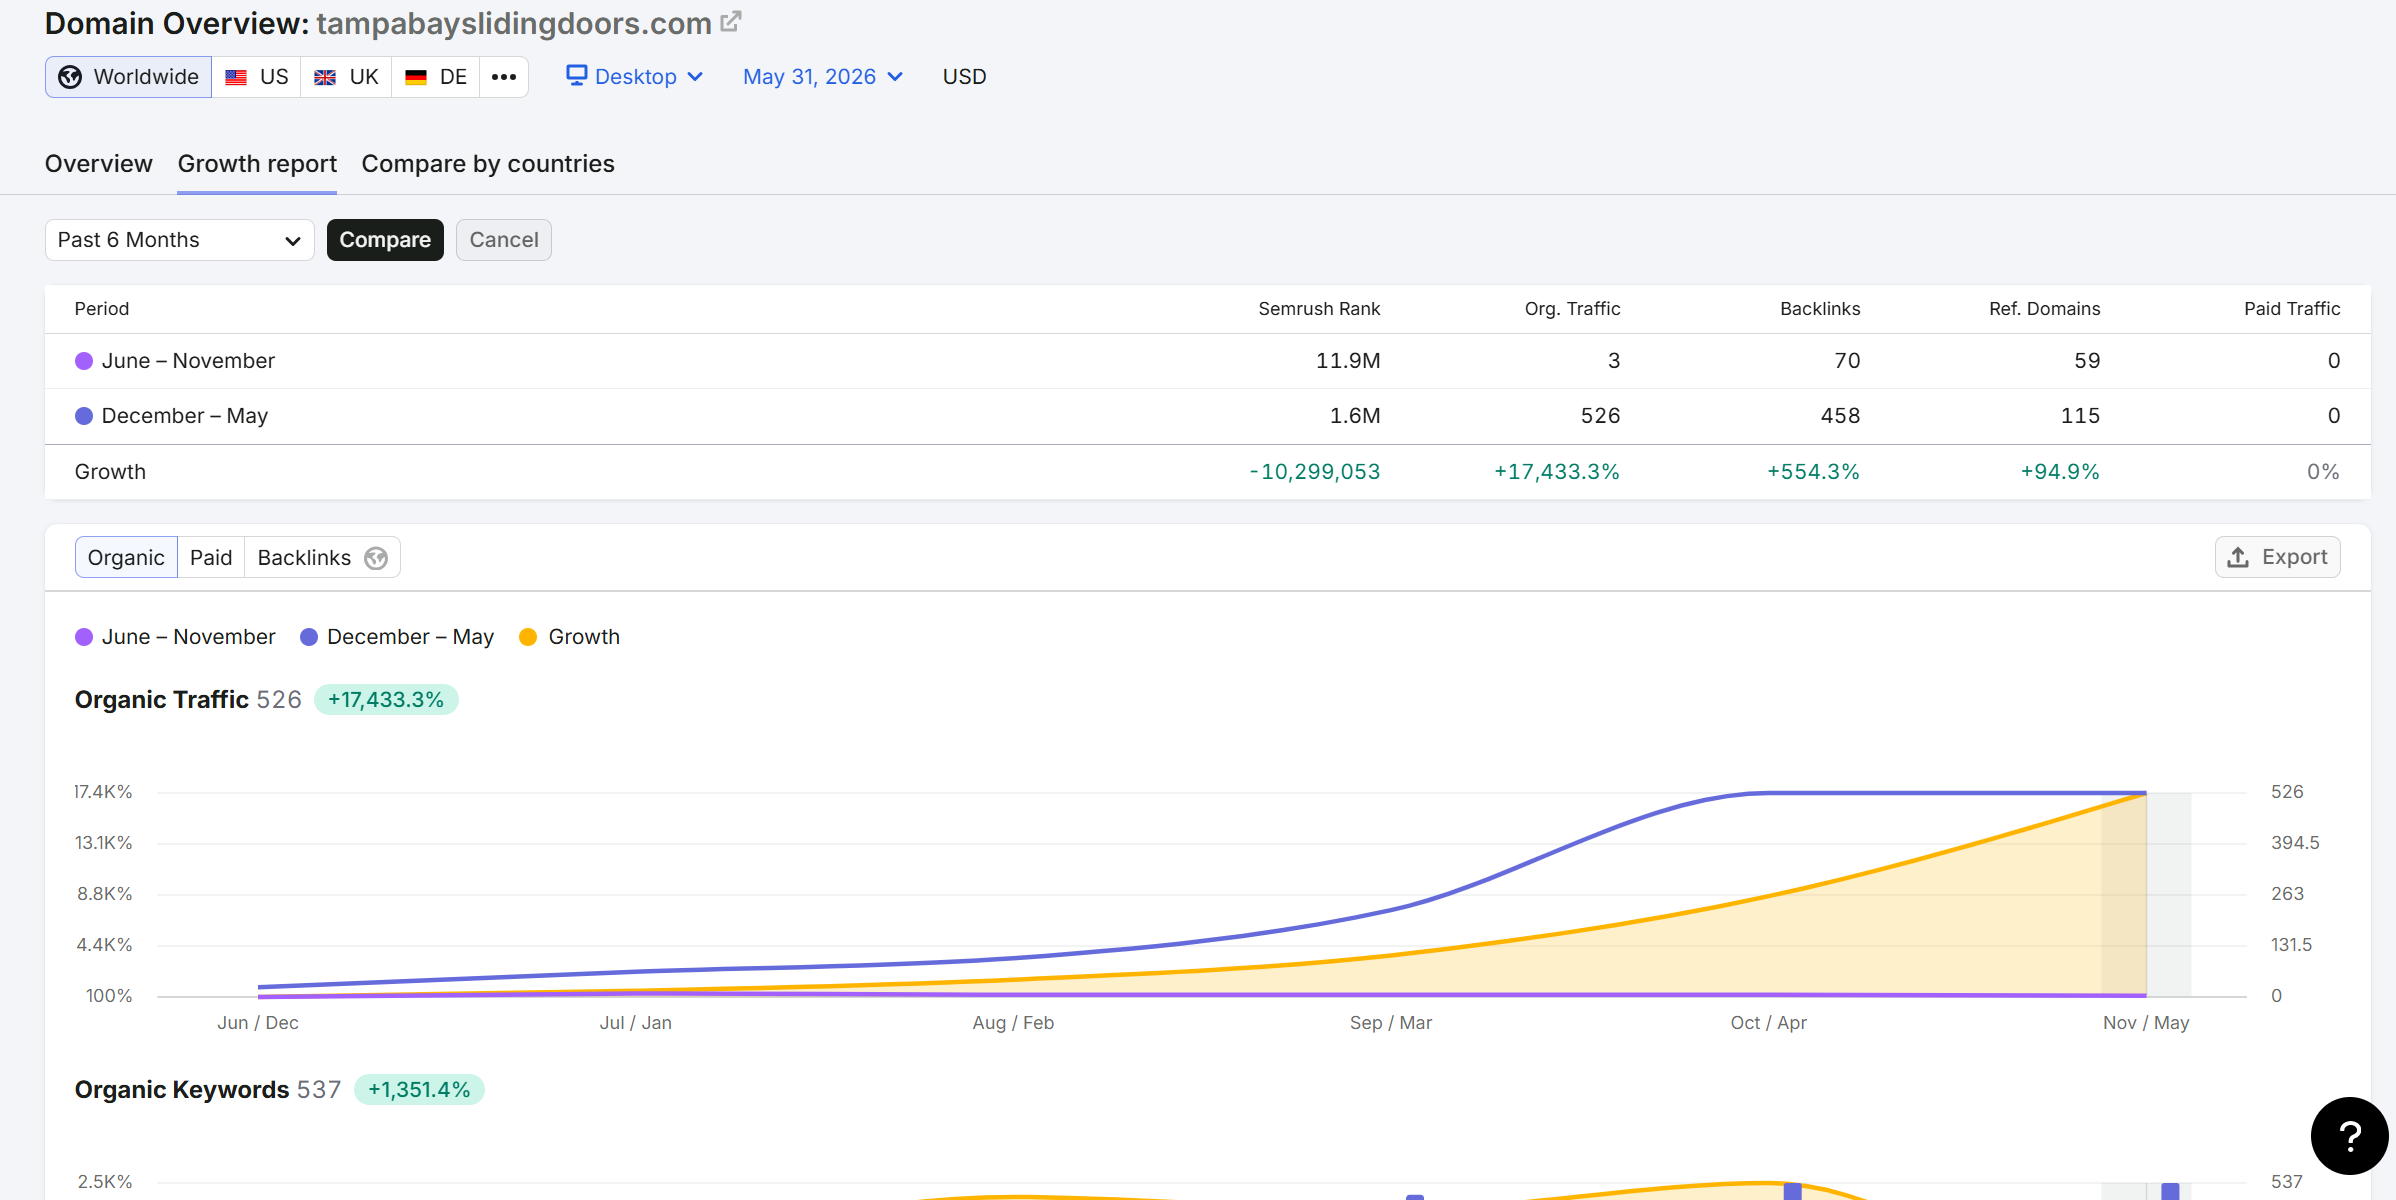
Tampa Bay organic traffic growth
Tampa Bay Sliding Doors
A local service SEO push that moved Tampa Bay Sliding Doors from minimal organic visibility to a stronger search footprint across traffic, keywords, backlinks, and local-service intent.
Local SEO, authority, and product coverage
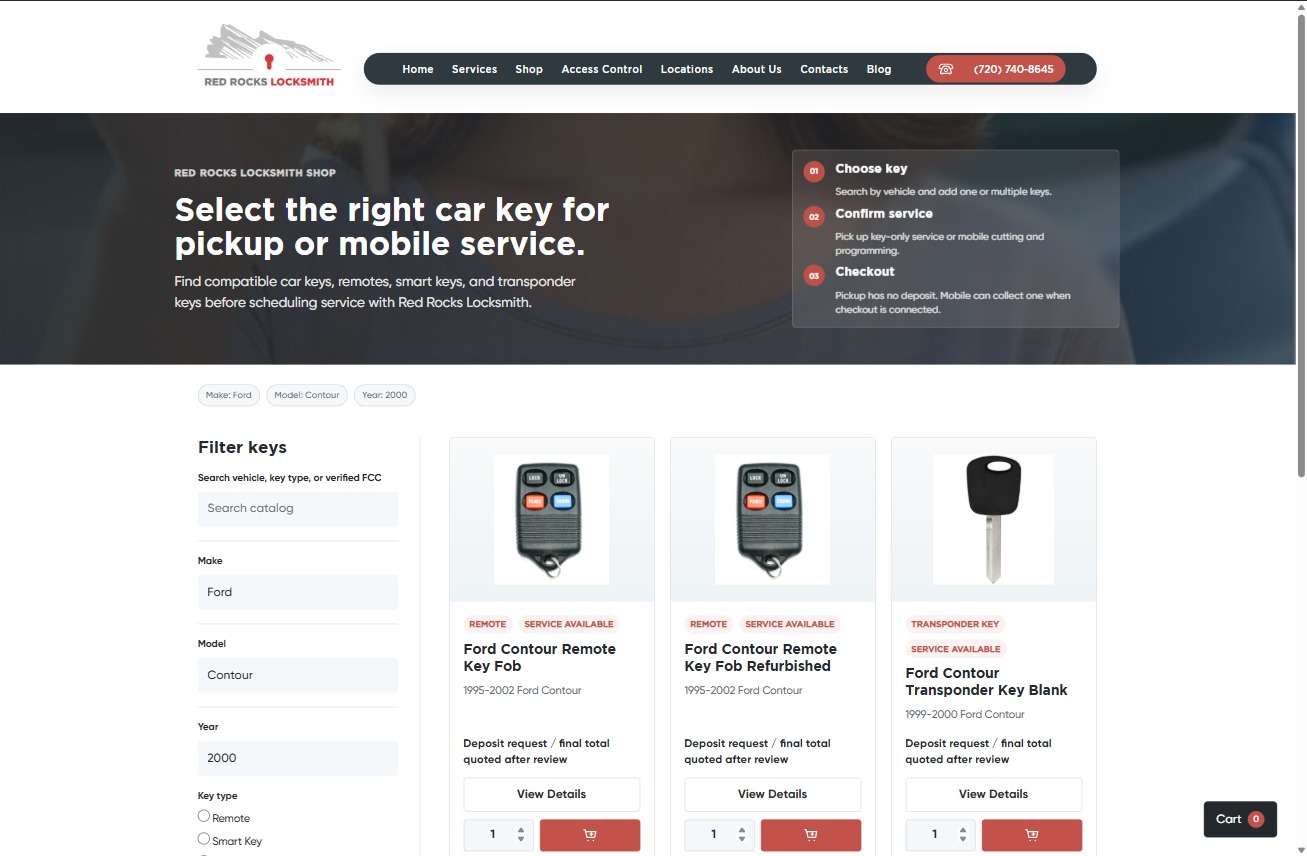
Red Rocks locksmith authority build
Red Rocks Locksmith
A local locksmith SEO strategy strengthened by an online automotive key catalog that created deeper service relevance, long-tail search coverage, and stronger internal authority.

Google Maps reputation defense
Google Maps review defense
Colorado Chimney Sweeps
A reputation-response playbook for a service business facing review abuse, extortion pressure, and Google Maps trust risk.
Related Blog
Articles connected to this service.
FAQ
No. Dashboards should make strategy sharper by showing which pages, campaigns, and workflows deserve attention.
Yes. The strongest setup connects organic, paid, page, and lead quality signals so decisions are not made in separate silos.
Next Step