
Marketing dashboards
Marketing dashboards that connect SEO, ads, pages, and lead quality.
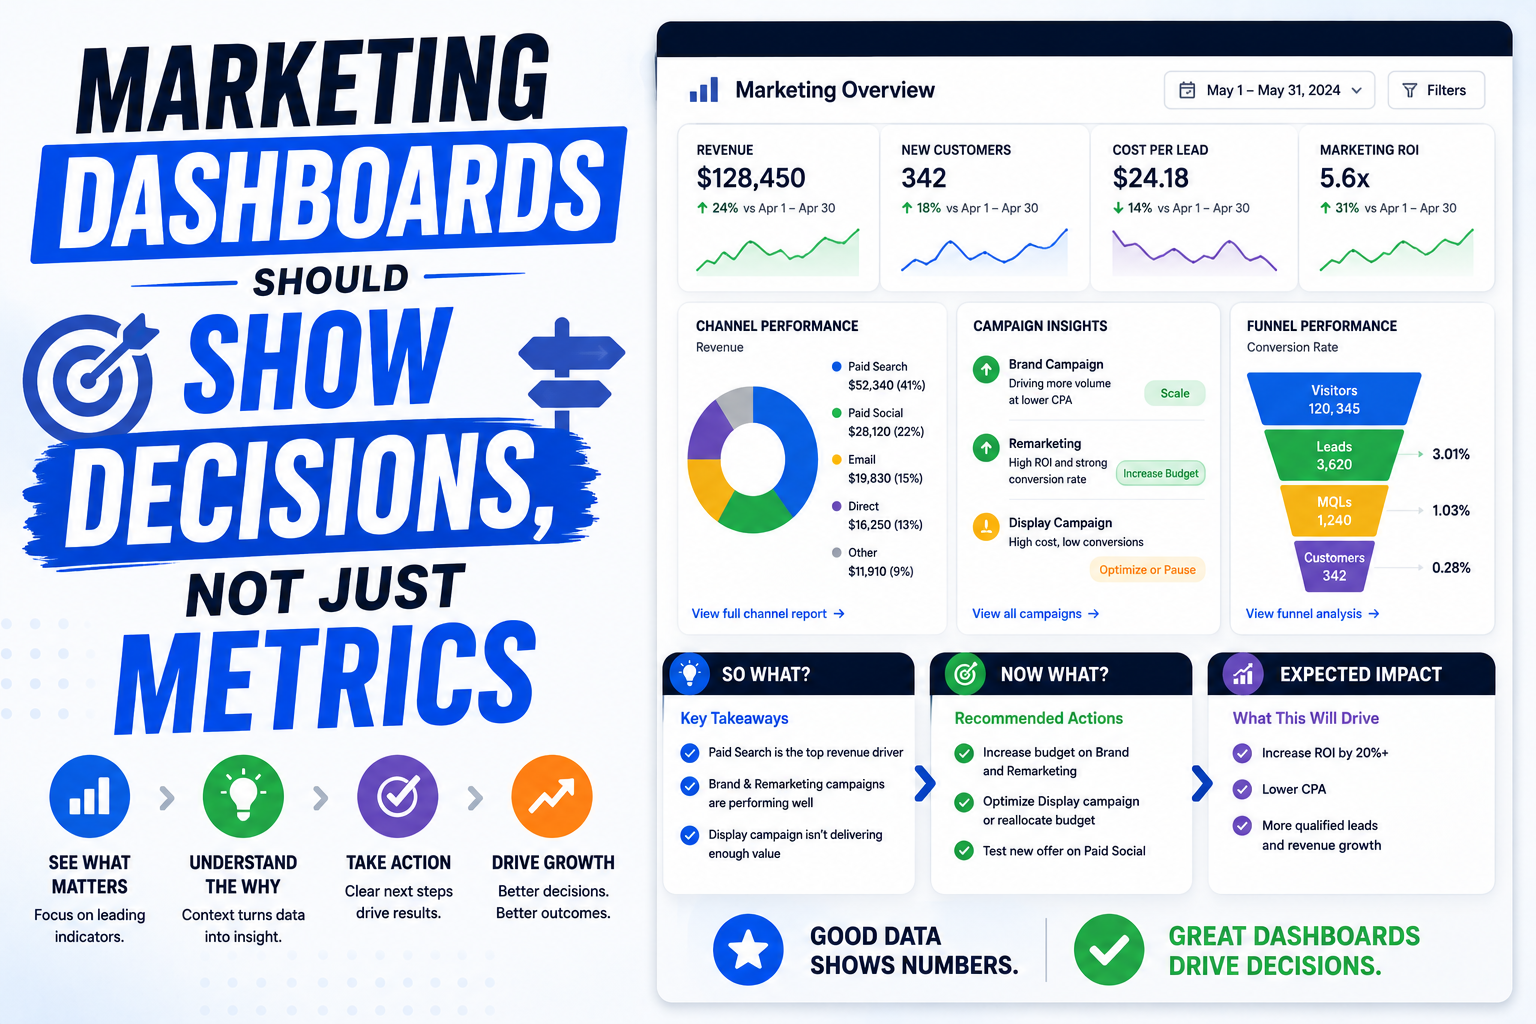
Build reporting views that show what is happening across channels and what decisions should happen next.
Problems We Solve
The work starts where growth is leaking.
Paired solution
Define the few views that actually support decisions across SEO, ads, pages, and conversions. For Marketing Dashboards, this supports the page promise directly: Build reporting views that show what is happening across channels and what decisions should happen next. It addresses reports live in separate with Dashboard structure, KPI map, and Channel views: Reports live in separate tools. The fix starts by deciding which page owns the topic, which supporting pages should exist, and which proof or internal links need to reinforce the path.
Paired solution
Dashboard map
Define the few views that actually support decisions across SEO, ads, pages, and conversions. For Marketing Dashboards, this supports the page promise directly: Build reporting views that show what is happening across channels and what decisions should happen next. It addresses reports live in separate with Dashboard structure, KPI map, and Channel views: Reports live in separate tools. The fix starts by deciding which page owns the topic, which supporting pages should exist, and which proof or internal links need to reinforce the path.
Deliverables
Clear outputs your team can use after launch.
Every Marketing Dashboards engagement leaves behind practical assets tied to implementation, ownership, and review. The goal is a cleaner operating path, not a static recommendation deck.
Audit the current path
Review the site, offer, lead flow, tracking, and operating constraints before recommending changes.
Build the first useful layer
Ship the pages, systems, tracking, or workflows that remove the clearest growth bottleneck.
Measure and improve
Use reporting, client feedback, and qualified lead quality to decide what gets scaled next.
Dashboard structure
Creates a review rhythm for pages, sources, actions, and lead quality so reporting turns into decisions.
KPI map
Creates a review rhythm for pages, sources, actions, and lead quality so reporting turns into decisions.
Channel views
Defines the asset, owner, review point, and next action needed to make the work useful after delivery.
Monthly notes format
Creates a review rhythm for pages, sources, actions, and lead quality so reporting turns into decisions.
Decision backlog
Creates a review rhythm for pages, sources, actions, and lead quality so reporting turns into decisions.
Delivery Process
Simple enough to start. Structured enough to scale.
Marketing Dashboards work moves through a tight operating rhythm: diagnose the real constraint, ship the highest-leverage layer, then use real signals to decide what deserves expansion.
Phase 1
Audit the current path
Review the site, offer, lead flow, tracking, and operating constraints before recommending changes.
Phase 2
Build the first useful layer
Ship the pages, systems, tracking, or workflows that remove the clearest growth bottleneck.
Phase 3
Measure and improve
Use reporting, client feedback, and qualified lead quality to decide what gets scaled next.
Filtered Case Studies
Relevant case study proof for this service.

PPC campaign structure and budget control
Google Ads waste-control structure
Google Ads strategy playbook
A Google Ads setup framework for service businesses that need buyer-intent campaigns without broad-match waste, weak conversion signals, or irrelevant clicks.
Branded PPC budget control
Branded search budget control
Google Ads strategy playbook
A branded search framework for deciding when company-name keywords deserve paid coverage, how to keep brand campaigns from overwhelming spend, and how to protect organic search from unnecessary cannibalization.
AI automation, CRM routing, and smart IVR
AI CRM lead automation
Service business automation system
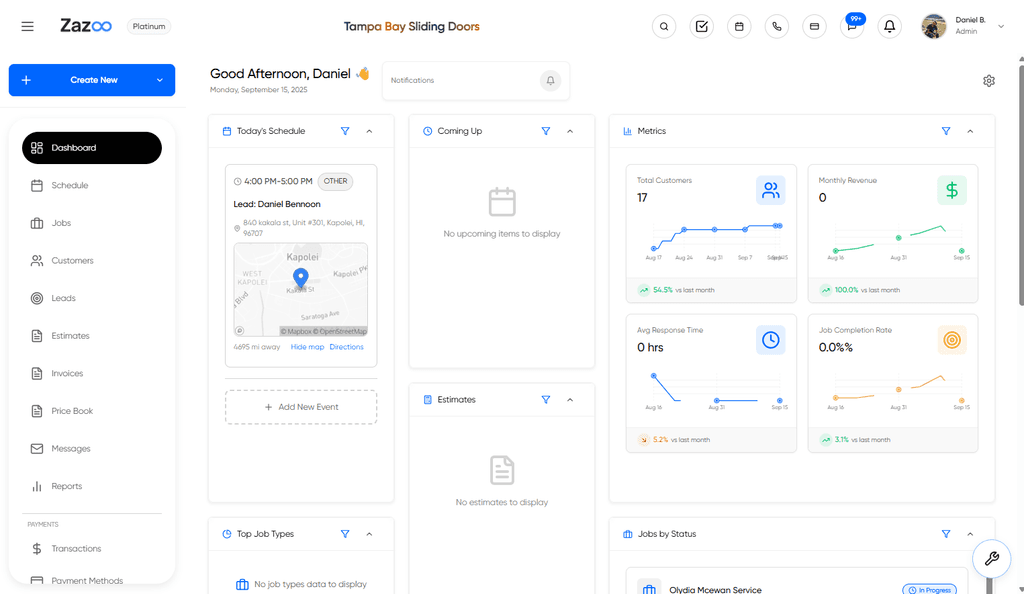
An operations blueprint for connecting Twilio, Zazoo, smart IVR, lead intake, scheduling, and CRM routing so service businesses capture and act on leads faster.
Related Blog
Articles connected to this service.
FAQ
No. The best dashboard is the one that helps decide what to do next.
Yes. Dashboards are most useful when tied to recurring improvement work.
Next Step